
Six tiles, one glance. The top of the dashboard, captured on November 10, 2026. The orange tile is real: a few of the data sources weren't answering at that moment. Nothing on this page is staged.
Case studiesMonitoring
How Proxy IT watches PrintedPrice.com from cloud regions, from local agents every minute and in a real browser, and knows within minutes when anything stops, slows down or goes stale.
Printed Price (printedprice.com) is a trade name of Proxy IT LLC.
Six tiles, one glance. The top of the dashboard, captured on November 10, 2026. The orange tile is real: a few of the data sources weren't answering at that moment. Nothing on this page is staged.
A basic uptime check loads a page and reports green when it answers. For a site whose whole promise is current information, that isn't enough. The home page can render perfectly while the deals behind it are hours old, a buying window the site still lists has closed, or a background job quietly stopped running.
So PrintedPrice.com is monitored the way it is used: from outside, from several places and in a real browser, and from inside, where every job and data source reports its own health. The dashboards on this page are the ones we work from, captured as they were on November 10, 2026.
A stale page is worse than a down page. A down page at least says so.

Six rows, one week. Data freshness is the top row, above whether the page loads at all. Every red sliver is a real failed check from that week. Swipe the timeline sideways to see the whole week.
Built for the person who owns the outcome, not the person who reads logs. Every tile is a plain word or one number with a colour, and the detail sits one click below for whoever has to fix it.
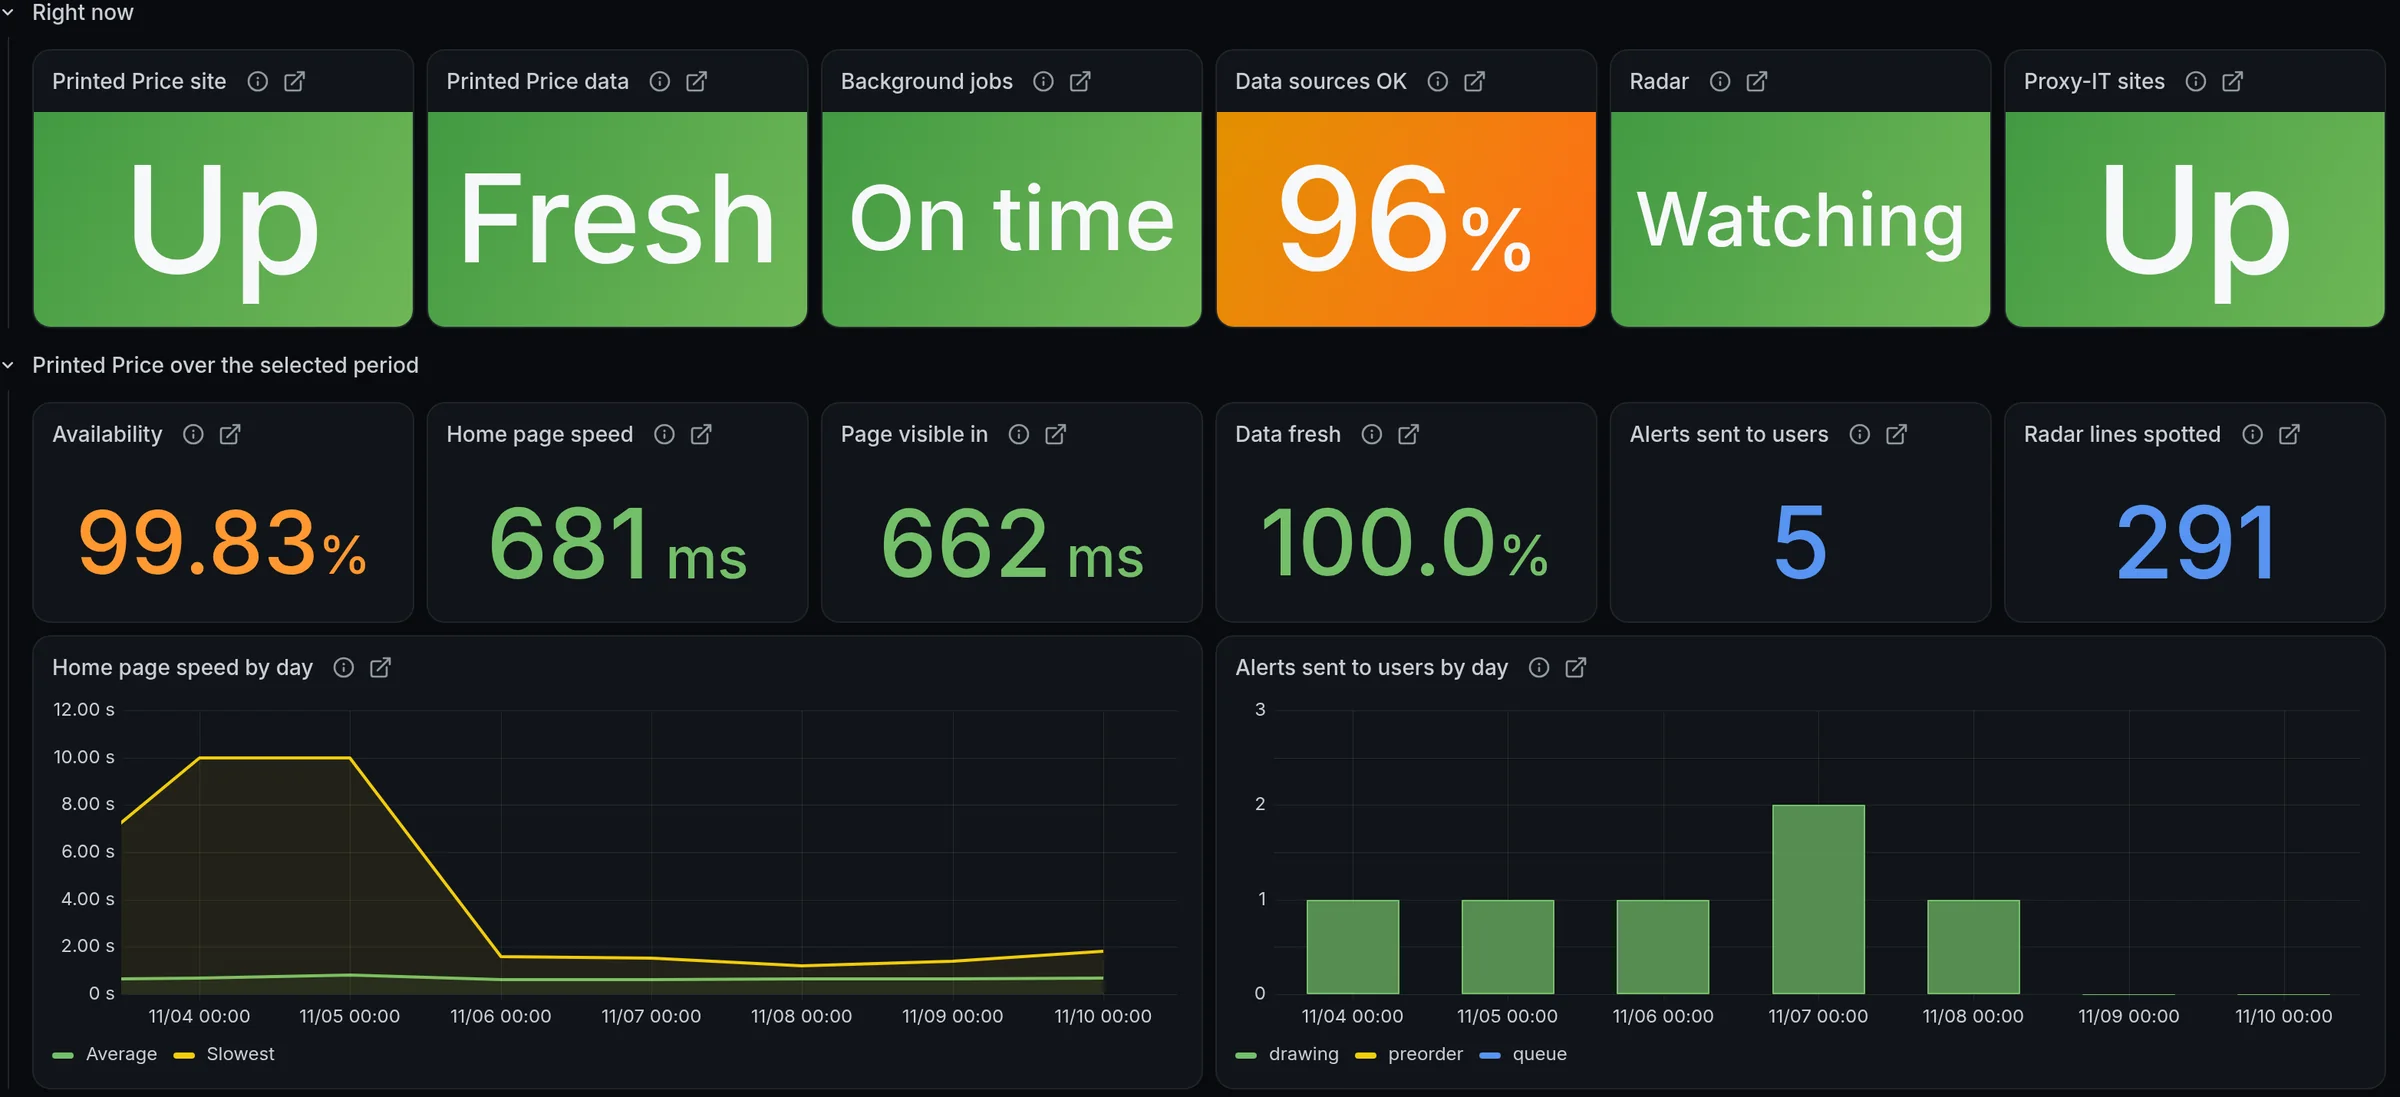
Two rows, then the trend. "Right now" answers the first question: is anything wrong? The second row shows the week: how often the site was up, how fast it loaded, how fresh the data stayed, and how many alerts collectors received. The charts underneath show when a slow day was slow.
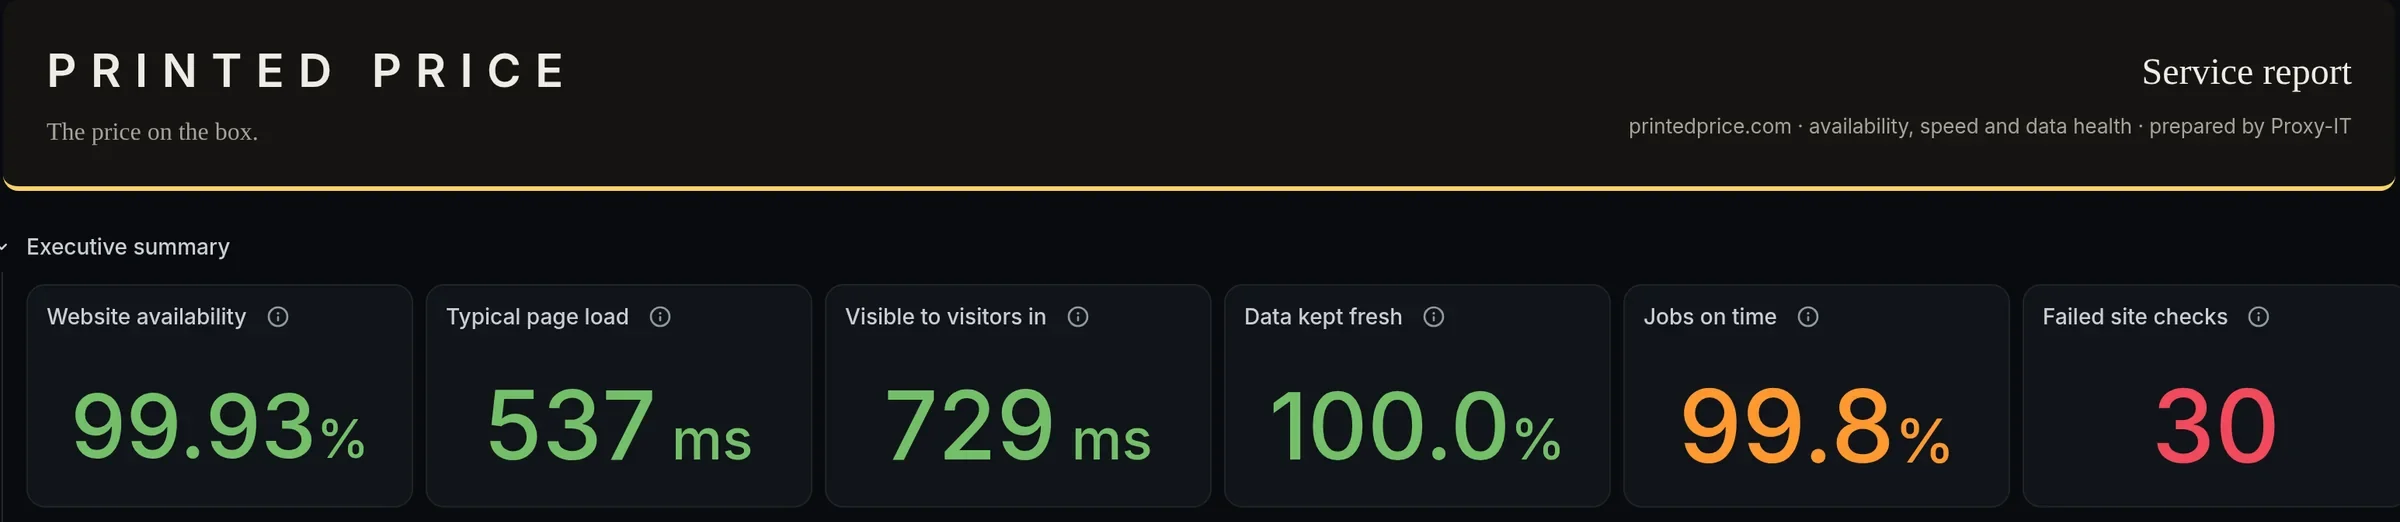
The same numbers, set in the brand's type and colours, with a plain-words note on how the site is watched. It reads like a report because it is one: availability, speed and data health for the month, including the checks that failed.

For a location, not just a site, we also watch the path out: local network, internet provider, DNS, cloud apps, then your own services. The first layer that isn't green is where to look, so the right call gets made before the wrong one. Watching a location for security changes, like a new device or the guest Wi-Fi reaching the register, is Network Watch.
Twenty rules, each written as a question a person would ask, each with a threshold agreed in advance, each emailed within minutes of the answer turning bad.
Fails when printedprice.com won't load from two or more cloud regions for five minutes. One region having a bad day doesn't page anyone.
The freshness check reads the public data behind the pages. Stale or empty, and it fails, even when the page itself loads fine.
Each background job has a deadline. A job that hasn't finished by it is treated as broken, whether it crashed or never started.
A source that goes quiet, a whole kind of source that goes down, or a listing count that drops suddenly: each has its own rule.
Key pages and the data behind them are checked from outside. A page that returns the wrong thing is as bad as one that doesn't return at all.
The engine reports its own health as it runs. If those reports stop arriving, the rule fires within a minute. Silence is a failure, not a pass.
Proxy IT's own sites get the same treatment: availability, certificate expiry, and whether the Hana download still works. Every alert goes to a person by email, with the rule's name and a one-line summary in plain words.
Two views of the same site, so a problem shows up wherever it starts.
Checks that load the site the way a person would, from places we don't control.
Signals the site sends about itself, so silence counts as a failure.

What a real browser measured over the week. The largest content on the home page was visible in 662 ms, the first content in about a second, the layout never shifted, and the server answered in 678 ms. The same numbers a performance audit would report, measured every day instead of once.
This is the monitoring piece of our IT support and managed services: the same checks, dashboards and alerts we run on our own platform, set up for your site, app or location.
Your site loaded from several regions, with the key pages checked for the right content, not just a response.
For any site that promises current information: a check that reads what your pages read and fails when it stops moving.
What visitors experience, measured on a schedule: load times, layout shifts and server response, with a week of history.
One screen that says Up, Fresh and On time, built for the owner, with the detail one click below for whoever fixes things.
Rules written as questions, with thresholds you agree to in advance, emailed to the people you name within minutes.
Availability, speed and data health for the month, in your brand, with a plain-words note on how it's monitored.
Quoted per site after a short call. We start by writing down what your site must do, agree the thresholds, and set up the checks, the dashboard and the alerts. You see the same dashboard we do. Alerts go out around the clock; how fast we act on them is written into your quote.
Tell us what your site must do, and we'll set up the checks, the dashboard and the alerts. No pitch, just a conversation.